


The content on this page is marketing communication
Second quarter performance update
It was a solid quarter for most of our funds.

SKAGEN Global A
Multinationals' strength drives relative gains as global equities suffer losses. SKAGEN Global fell 1.4% in the quarter, outperforming the MSCI All Country World Index which dropped 2.3%.

Figures as at 30 June 2017 in EUR, net of fees and annualised for periods greater than one year
* Inception date: 07/08/1997
** Before 01/01/2010 benchmark was MSCI World Index
- Samsung Electronics was the top quarterly performer, boosted by strong memory chip sales and expectations of improved corporate governance following the Korean presidential election of Moon Jae-in. Unilever was the next best performer with the Anglo-Dutch consumer goods manufacturer delivering a well-received strategic update following the failed bid by Kraft-Heinz.
- General Electric was the largest detractor with the US industrial conglomerate generating disappointing first quarter cash flows. Teva was the next weakest performer as the Israeli pharma company continues to be hurt by falling generic drug prices and a large debt position.
- Following the addition of insurance broker Marsh & McLennan earlier in the quarter, two new companies joined the portfolio in June: Henkel, where we believe the market underestimates the strength of the German manufacturer's balance sheet, capital discipline and adhesives division, and Hong-Kong based property conglomerate Cheung Kong Property Holdings, which trades at an attractive discount to NAV with the potential for growth in earnings, dividends and share buy-backs.
- We exited Teva given its deteriorating risk-reward profile (see above) as well as Lenovo and US holdings Amerco and ServiceMaster to redeploy capital into more attractive opportunities.
- The portfolio remains attractively valued with average upside of 25% for the top 35 holdings*.
Quarterly Report: Read the SKAGEN Global Q2 Report
SKAGEN Kon-Tiki A
Korean holdings' strength offsets Brazilian weakness as EM outperformance continues. SKAGEN Kon-Tiki lost 2.7% in the quarter, underperforming the MSCI Emerging Markets Index, which fell 0.7%.

Figures as at 30 June 2017 in EUR, net of fees and annualised for periods greater than one year
* Inception date: 05/04/2002
- Samsung Electronics was the fund's top performer while expectations of stronger Korean corporate governance also boosted LG Electronics which further benefited from solid results which saw its handset division break even.
- Cosan was the largest detractor with the conglomerate hurt by low sugar prices and a weak Brazilian equity market amid political turmoil. Compatriot Banrisul was the next worst performer with the bank also marked down as its chances of privatisation receded.
- China Unicom and LM Ericsson were added to the portfolio early in the quarter.
- Five companies left the portfolio: Sistema was sold given the risk created by Rosneft's legal action, OCI and GCL-Poly exited due to solar sector concerns while Apollo Tyres and EFG-Hermes departed following strong share price performance.
- The portfolio remains attractively valued with average upside of 29% for the top 35 holdings*.
Quarterly Report: Read the SKAGEN Kon-Tiki Q2 Report
SKAGEN Focus A
Relative gains as falling oil price creates portfolio winners and losers. SKAGEN Focus was down 1.7% in the quarter, outperforming the MSCI All Country World Index which lost 2.3%.
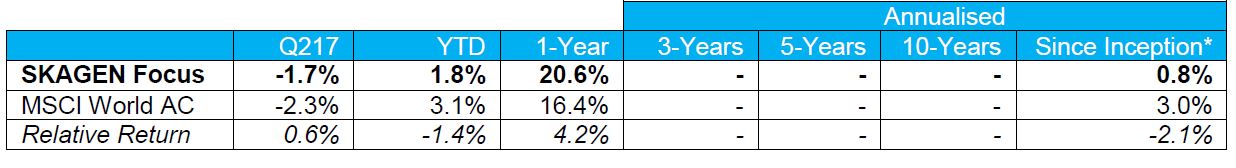
Figures as at 30 June 2017 in EUR, net of fees and annualised for periods greater than one year
* Inception date: 26/05/2015
- Philips Lighting was the best performer, boosted by solid earnings and a well-received share saleby the with the Dutch electronics company's former owner Royal Philips. Tesoro was the next largest contributor with the US oil refiner benefitting from higher margins as the oil price fell.
- JBS was the largest detractor as the Brazilian meat-packer's parent company J&F agreed to pay record corruption fines. Whiting Petroleum was the second biggest detractor with weak oil prices hurting the US exploration and production company.
- Following Bank of Kyoto, Gestamp Automoción and X-FAB earlier in the quarter, Helmerich & Payne joined the fund in June; the US-based contract driller of oil & gas wells has a strong balance sheet and offers an attractive dividend yield.
- Three companies exited the fund; we sold Pilgrim's Pride – another J&F subsidiary – after relatively strong equity performance while Philips Lighting and Korean chip-maker SK Hynix departed after reaching our price targets.
- The portfolio remains attractively valued with average upside of 53% for the top 10 holdings*.
Quarterly Report: Read the SKAGEN Focus Q2 Report
SKAGEN Tellus A
Portuguese economic recovery and underweight USD / JPY exposure drive relative gains. SKAGEN Tellus fell 2.0% in the quarter, outperforming the JPM Broad GBI Unhedged index which dipped 3.7%.

Figures as at 30 June 2017 in EUR, net of fees and annualised for periods greater than one year
* Inception date 26/05/2015
** Before 01/01/2013 benchmark was Barclay's Capital Global Treasury Index 3-5 years
- Our Portuguese bond holding was the best performer, appreciating 6.5% as interest rates fell by 85 basis points. Portugal's economic revival – annual GDP growth improved to 2.8% in Q117 from 2.0% in Q416 – has recently seen it progress to the preventive arm of the EU's Stability and Growth Pact.
- Relative outperformance was driven by underweight positions in USD (15% of Tellus vs. 38% of the index) and JPY (0% vs. 19%) while absolute returns were negatively impacted by portfolio currencies depreciating against the EUR, particularly USD which fell 7%.
- The fund's duration is currently 4 years, substantially below the benchmark (7.8 years) and we only take interest rate risk in countries with a solid case for future rate reductions and / or the yield is very attractive.
- Tellus has longer duration in countries where we expect the credit premium to fall (e.g. Portugal, Croatia) or where there is a high running yield (e.g. Peru, Mexico, Chile) while it has very low duration where we predict currency appreciation (e.g. US, UK, Canada, Norway).
Quarterly Report: Read the SKAGEN Tellus Q2 Report
_________________
* Potential upside based on internal price targets over a two-year investment horizon.
All contribution figures are based on NOK returns at the fund level.
Important information
Except otherwise stated, the source of all information is SKAGEN AS as at the date of the publication of the investment report. Historical returns are no guarantee for future returns. Future returns will depend, inter alia, on market developments, the fund manager's skills, the fund's risk profile and subscription and management fees. The return may become negative as a result of negative price developments. Statements reflect the portfolio managers' viewpoint at a given time, and this viewpoint may be changed without notice. This report should not be perceived as an offer or recommendation to buy or sell financial instruments. SKAGEN AS does not assume responsibility for direct or indirect loss or expenses incurred through use or understanding of the report. Employees of SKAGEN AS may be owners of securities issued by companies that are either referred to in this report or are part of the fund's portfolio. We always recommend that you speak to your financial adviser before making any investment decisions. They can take into account your personal circumstances when discussing financial objectives and how best to achieve them. Before you invest, you should consider and understand the risks of investing in the funds. Further information on the funds and the risks associated with investing can be found in the Full Prospectus or the Key Investor Information Document(s). These documents are available in English on our web pages.