


The content on this page is marketing communication
Performance Update Q2 2018
SKAGEN Performance Update – A volatile second quarter
SKAGEN Global
Strong absolute gains amid turbulent global equity markets; portfolio upside remains high at 29%. SKAGEN Global A increased 7.7% in the quarter, underperforming the MSCI All Country World Index which climbed 8.1%.
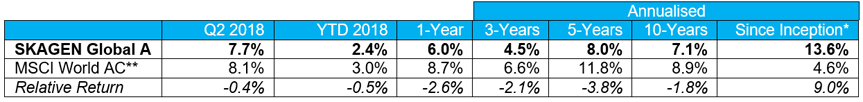
Figures as at 30 June 2018 in EUR, net of fees and annualised for periods greater than one year
* Inception date: 07/08/1997
** Before 01/01/2010 benchmark was MSCI World Index
- US technology giant Microsoft was the largest contributor as the long-term holding continues to benefit from growth in its cloud business. Capgemini was the next best performer with the French technology company boosted by supportive trends in global digitalisation and solid execution.
- IRSA was the weakest performer with Argentinian conglomerate pulled down by a weak domestic equity market as the country faces continued economic pressure. 3M was the next largest detractor as the US multinational was negatively impacted by concerns over global trade.
- Four holdings entered the fund with Tyson Foods re-joining the portfolio in June – we see the leading US chicken producer as a beneficiary of structural protein trends – following new investments in UPM- Kymmene, Moody’s Corporation and Mastercard earlier in the quarter.
- Seven companies left the portfolio with the sale of CK Hutchison Holdings and Carlsberg in June following earlier exits from DSM, Philips, Thyssenkrupp, Hyundai Motor and Columbia Property Trust.
- The portfolio is attractively valued with the top ten positions trading at 14.1x forward earnings and offering 29% upside1.
Quarterly Report: Read the SKAGEN Global Q2 2018 Report here (pdf)
SKAGEN Kon-Tiki
Macro and trade war concerns drag on EM performance as portfolio upside increases to 46%. SKAGEN Kon-Tiki A fell 2.1% during the quarter, underperforming the MSCI Emerging Markets Index which dropped 1.8%.
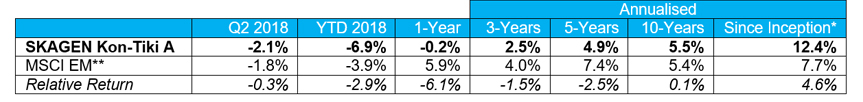
Figures as at 30 June 2018 in EUR, net of fees and annualised for periods greater than one year
* Inception date: 05/04/2002
** MSCI EM Index (net total return) did not exist at the inception of the fund and consequently the benchmark index prior to 1/1/2004 was the MSCI World AC Index. This is not reflected in the table above which shows the MSCI EM Index since the fund’s inception
- Mahindra & Mahindra was the largest quarterly contributor with the Indian auto manufacturer delivering solid results which were boosted by growing domestic rural demand. Ericsson was the next best performer as the Swedish telecom company announcing strong results which signalled its turnaround plan is gaining traction.
- Banrisul was the largest detractor with the Brazilian bank weighed down by a poorly performing domestic stock market and political interference. LG Electronics was the next largest drag on performance with the Korean company impacted by concerns over a potential trade war and weak financial performance from its LG Display subsidiary.
- We initiated a new position in Robam during the quarter as we expect the Chinese kitchen appliance manufacturer to benefit from growing domestic demand for premium extractor fans and cooker hoods.
- We exited from three companies during the period; Bolloré departed due to heightened governance risk, Kinnevik was sold as the Swedish investment company approached our target price and we took profits in Gree Electric following the suspension of the Chinese appliance producer’s dividend.
- The portfolio valuation remains highly attractive with the top 35 holdings, representing 88% of the fund, trading on a 2019 P/E of 7.6x, 28% below the index and with weighted upside of 46%[1].
Quarterly Report: Read the SKAGEN Kon-Tiki Q2 2018 Report here (pdf)
[1] Potential upside based on internal price targets over a two-year investment horizon.
SKAGEN Focus
Solid absolute return as market volatility creates opportunities for new investments. SKAGEN Focus A increased 4.8% over the quarter, lagging the MSCI All Country World Index which climbed 8.1%.
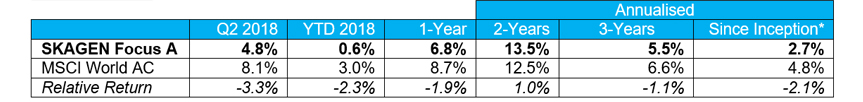
Figures as at 30 June 2018 in EUR, net of fees and annualised for periods greater than one year
* Inception date: 26/05/2015
- Whiting Petroleum was the top performer with the US exploration company boosted by the oil price rally and strong operational performance. Teva was the next largest contributor as the Israeli pharmaceutical company’s turnaround gains momentum under a new management team.
- Telecom Italia was the largest detractor, weighed down by the country’s continued political uncertainty. Renault was the next weakest performer with the French car manufacturer marked down following President Trump’s threat to impose US import tariffs on European-made cars.
- We added five new holdings with Canadian copper miner Ivanhoe Mines, Korean construction materials manufacturer KCC and Turkish conglomerate KOC Holdings entering the portfolio in June, following the addition of ADT and Metro earlier in the quarter.
- We exited from six holdings with Whiting Petroleum, Fila Korea and Village Supermarkets departing in June on achieving our share price targets, following the earlier sales of Carlsberg, Hanil and Asia Cement.
Quarterly Report: Read the SKAGEN Focus Q2 2018 Report here (pdf)
SKAGEN Insight
Market turmoil drives weaker activist performance; positive corporate transformation across the portfolio. SKAGEN Insight A rose 3.15% during the quarter, underperforming the MSCI World Index which was up 9.5%.
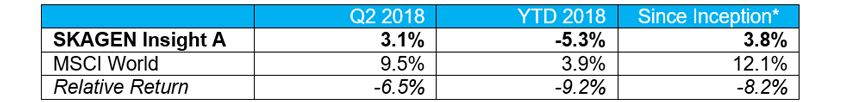
Figures as at 30 June 2018 in EUR and net of fees
* Inception date: 21/08/2017
- Ericsson was the largest contributor, boosted by solid quarterly results that many saw as an important turning point for the Swedish telecom giant. Hudson’s Bay was the next strongest performer as the US department store chain seeks to realise value from its attractive asset base.
- Car rental company Hertz was the largest detractor followed by Swedish infrastructure services group Eltel, despite both companies delivering better than expected results; we remain optimistic about the two holdings based on the operational improvement and corporate change currently taking place at both companies.
- We exited from Korean company GS Home Shopping during the quarter to invest in compatriot Hyundai Motor where Elliott, the activist who brought about change at Samsung Electronics, initiated a position.
- The portfolio is attractively valued, currently trading on a P/E (t+3) of 10.1x, representing a 25% discount to the broader market.
[1] Potential upside based on internal price targets over a two-year investment horizon.
Quarterly Report: Read the SKAGEN Insight Q2 2018 Report here (pdf)
SKAGEN Tellus
Dollar strength boosts returns as emerging market volatility drives relative weakness. SKAGEN Tellus A added 0.7% in the quarter, underperforming the JPM Broad GBI Unhedged index which rose 2.4%.

Figures as at 30 June 2018 in EUR, net of fees and annualised for periods greater than one year
* Inception date 26/05/201529/09/2006
** Before 01/01/2013 benchmark was Barclay's Capital Global Treasury Index 3-5 years
- Our short-dated US Treasuries were strongest performer, boosted by the dollar’s appreciation over the quarter. The Dominican Republic also contributed significantly as the peso maintained its value relative to the dollar and long-term interest rates fell.
- Our Uruguayan holding was the weakest performer as negative sentiment towards neighbouring Argentina resulted in sharp currency depreciation and an increase in interest rates. Mexico provided the second largest detractor, weighed down by uncertainty over its presidential election and US trade relations.
- We made a new investment in a short duration Czech Republic bond; the country is growing solidly and has very low unemployment. The fund switched its USD-denominated Dominican Republic investment into an international DOP-denominated bond as we see greater upside in the local bonds than the hard currency equivalents.
- We also increased our holding of short-dated US Treasuries as we reduced our exposure to New Zealand.
Quarterly Report: Read the SKAGEN Tellus Q2 2018 Report here (pdf)
----------
All contribution figures are based on NOK returns at the fund level.
Historical returns are no guarantee for future returns. Future returns will depend, inter alia, on market developments, the fund manager’s skill, the fund’s risk profile and subscription and management fees. The return may become negative as a result of negative price developments.
This message is only intended for the recipient and may contain confidential or other private information.